While trying to profile McCLIM I came to the conclusion that the statistical profiler contrib wasn't very useful for profiling applications (as opposed to SBCL internals). It didn't look through the call stack, and would therefore usually just report the low-level operations where most of the time was being spent. As a concrete example, the profiler could tell that during a session of waving the pointer over a gsharp window SBCL would mostly be doing various bignum calculations, but there would be no hint about why.
After a bit of hacking sb-sprof can now generate deeper call graphs on x86 and AMD64, resulting in reports with a more useful level of detail. For example in this case it's obvious that the bignum calculations are coming from comparing floats to fixnums, which is currently implemented by rationalizing the float (that being the simplest way to conform to 12.1.4.1). Some smaller improvements were commited along with this, like reporting the time spent individual foreign functions instead of just grouping them all under "elsewhere".
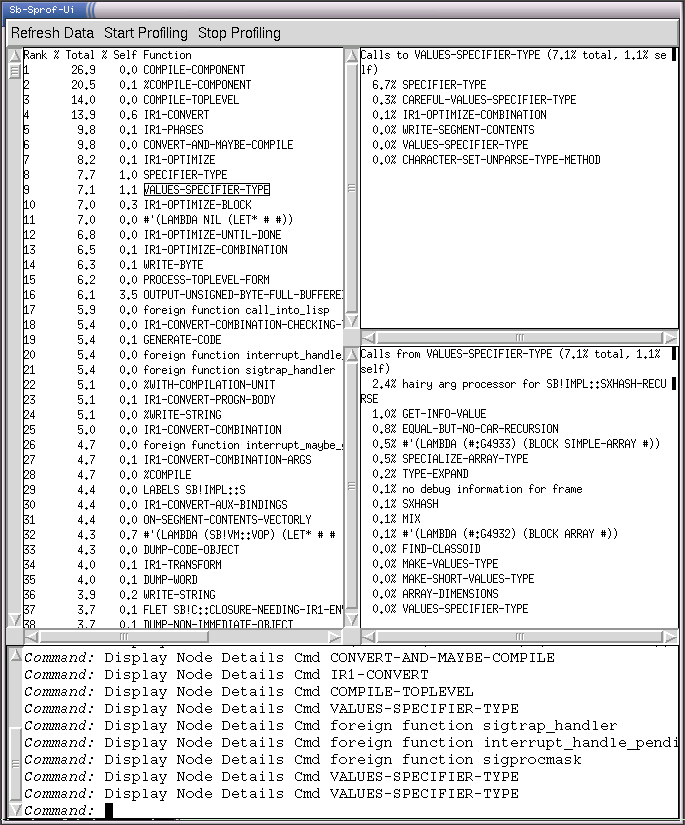
I've also hacked a small CLIM frontend for browsing sb-sprof results, sb-sprof-ui (asdf-installable). Here's a screenshot (with some courier-default-ugly — I couldn't figure out how to change the font in the command pane):
Oh, and the AMD64 port is now in HEAD. Thanks to everyone who has contributed both before and after the merge.