Introduction
This post is a description of some tools and data analysis I did for detecting players using multiple user accounts in an asynchronous online game. The code is available at GitHub.
A couple of months ago one of the players on
my Online Terra Mystica site
had some concerns that some of the
players in the
tournament were playing with multiple
accounts. So I decided to do a bit of digging into the logs to see
whether it was really happening or just paranoia.
Gathering and preprocessing the data
Before doing anything else, we need some data to work with. It happens that I store a log record for every move done in any game, mostly for debug purposes. That record contains a bunch of information, but the ones we're going to work with in this analysis are the following:
- username
- game
- timestamp
- IP address
I used the records for all games played in period the tournament ran for (two months starting May 1st), but only looked at players who had entered the tournament (about 750).
The first order of business was to find some suspicious users. I defined this as two users making at least one move from the same IP address on the same day. There were a couple of surprising things. First, 230 players were "suspicious", which was a lot higher than I would have expected. Second, it wasn't just that a user happened to arrive from the same IP as a single other user. It could be as high as 10 other users. There must be a lot more IP address reuse and sharing going on than I was assuming. So this really won't work as anything except a first filter to reduce the search space a bit.
The next step is to process this data into something that can be used for automatically assessing the similarity of the access patterns of two users. The data in the current form makes it easy to determine whether two players did a move at roughly the same time. But there's also information in the times where no moves were made, as long as it was the turn of one or both of the players to move.
The transformation to get that data is simple: during processing of the input data we keep track of the timestamp T of the last move done in each game. When we see a new record for a game, we mark it having been that users turn from T to the timestamp of the new record. This is an approximation, since a game can be waiting for input from multiple players at the same time. But it should be good enough, since the only effect of getting this wrong is moving some samples from weak dissimilarity to no signal.
Finally, the analysis I had in mind wasn't going to work on a continuous scale, so the data is bucketed into 30 minute intervals [1].
Quantifying similarity
The next step is to compute a similarity score for the access patterns of two accounts.
There's three states a player could be in for a given time segment, which we'll label "moved" (player moved at least once), "stalled" (player's turn in at least one game, but did not move) and "idle" (otherwise). There's 9 combinations of these states for two players, and depending on the whether the combination supports or refutes similarity we assign a positive or negative score based on the following table:
| B moved | B stalled | B was idle | |
| A moved | -10/10 | -5 | 0 |
| A stalled | -1 | 1 | 0 |
| A was idle | 0 | 0 | 0 |
Moves being done at the same time is a very strong signal, either positive or negative depending on whether the moves were done from the same location or not. Both players being stalled at the same time is a very weak signal (though if the players are stalled for a long time, it can add up since this score is computed once per time segment).
You might have noticed that the matrix is not symmetric. We treat A moving while B stalls different from B moving while A stalls. This is done to deal with a common pattern where the main account makes moves from both a main computer and a mobile phone, while the sockpuppet makes moves only from the computer. These accounts will appear very similar on visual inspection but just mildly similar if both cases were treated as a strong negative signal. With an asymmetric scoring matrix, all the strong negative signals will accumulate for one user, leaving the other account with a high similarity score. [2]
There's also a non-local signal that I'm using. In the case where both accounts moved from the same IP, the score is adjusted higher if both accounts had been stalled for a long time just before making those moves. The theory here is that it's a much stronger signal for two players to make a near-simultaneous move after say two days of unforced inactivity than after half an hour of inactivity, since long periods of inactivity tend to be rare, and it should be rarer yet for that period to be finished at exactly the same time for persons that are truly distinct.
These scores are then summed up, divided by weight (essentially the sum of the absolute values of the scores, but there's a small initial weight so that account pairs require a decent number of samples before showing alarming levels of similarity). This -1 to 1 range is then further normalized to a 0 to 1 range, which I find that more convenient to work with.
A tiny bit of fudging in the above description is that to deal with quantization discontinuities (A makes a move at 16:29, B makes a move at 16:31), we actually look at a sliding window of three time segments rather than process them completely invidually. Since time segments with moves are sparser than non-moves, this will increase the further effective weight of the top-left 10/-10 cell in the matrix. When picking the single cell in the table that gets scored, moved > stalled > idle, so a single matching (or mismatching) pair of moves might get scored up to three times.
Visualization
In order to get some idea of whether the similarity measure is reasonable or not, we also need some way of visualizing the data of some subset of users. After an hour of trying to get something even remotely readable from R (which usually is pretty decent at visualizing data), I gave up in disgust and just wrote a tiny Perl script to just generate a SVG file directly.
It simply has one wide column for each IP address running horizontally, and time running vertically. Each user has a different color for drawing their interactions with the site, as well as their own smaller strips of the full per-IP columns. A time segment where the user did a move is drawn as a square, a time segment where they stalled is drawn as a thin rectangle / line.
Here's an example from a hilarious clique of 8 separate accounts, mostly playing in near-perfect lockstep. How many distinct persons are involved? Click on the thumbnail to open the full image:

This visualization is not perfect. The biggest problem is that with more than about 20 addresses involved there's just too much horizontal scrolling involved on comfortable zoom levels. This would not be impossible to solve. Generally if there are large amounts of IPs involved most of them are completely ephemeral, and could somehow be folded together.
Evaluation
I looked at the similarity scores of some people I know in real life and suspected might be false positives (e.g. working in the same place, or living in the same place. These tended to be in the 0.4-0.6 range. I also looked at some cases where I was essentially certain were being played by the same person based on other metadata. The scores for those were over 0.9. The latter seems like a reasonable threshold value for flagging particular pairs accounts for more scrutiny.
When the 7th season of the tournament started, there was a rules change put in place explicitly to forbid playing with multiple accounts. There were no retroactive penalties of course, but looking at how people's behavior changed might provide us with some hints about whether this algorithm was at all on the right track.
I got emails from people who were horrified that they might be banned because both they and their SO played the game. All of these cases were well below the threshold. There were also people apologizing for playing with multiple accounts, saying they hadn't thought it was wrong. These cases tended to be at or above the threshold.
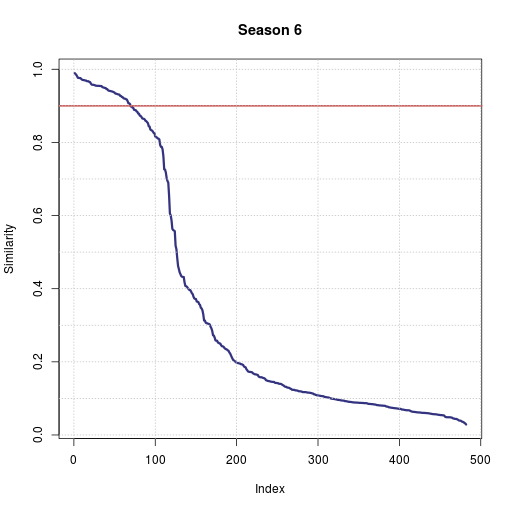
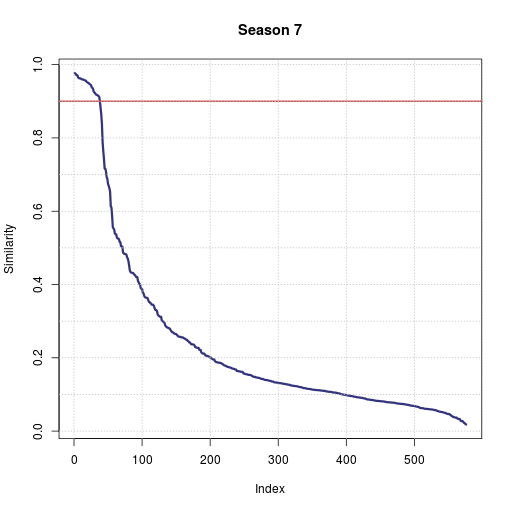
A decent way of visualizing the effect of the rule change is looking at the distribution of the similarity scores for season 6 vs season 7. The way to read these graphs is that the most similar pair of users in season 6 had a similarity of 0.99, the 80th most similar pair a score of 0.9. (Also remember that the scores are not symmetric, so every pair of users with any similarity shows up twice in this graph, once per direction). You can see the proportion of very suspicious accounts being cut in half from one season to the next while the rest of the graph has roughly the same shape:
And as some final behavioral metrics, there were 13 suspicious cliques of users in season 6. At least one player continued on to season 7 from every clique, but in 8 out of 13 cases each clique shrunk down to just one player. After the rules change, players above the flagging threshold were about 3 times as likely to not join season 7 than the average player.
Conclusion
A comment I got when I gave a draft of this article to some friends was that it's stupid to write an article about exactly how any kind of anti-cheating setup works. All it does is allow cheaters to figure out exactly what they need to do to game the system. This is definitely true in the general case.
I'd like to hope that this isn't an issue in this case. It's a relatively small community, the stakes are low, getting any advantage from cheating would be hard work since you'd need about a year if playing to work a sockpuppet player into the top divisions. And the workarounds you'd need are pretty obvious, not anything clever. My impression is that everyone who had been doing this was simply wanting to play in more games, and thought that it wasn't really forbidden. Trying to work around this kind of a detection system by connecting different sockpuppets through different proxies should produce some fairly heavy cognitive dissonance with the idea that this is an allowed practice :-)
Oh, and what about the user whose complaint triggered this little investigation? It turns out that everyone else playing in his league was squeaky clean. Unfortunately the setup of the tournament (with each division having twice as many leagues as the previous one) means that you'll always have pretty high skill differences in the lowest division. The lowest division will after all on average contain a third of the entire tournament's players, and might contain as many as half.
Footnotes
[1] Half an hour is totally arbitrary. I wonder if there's some good way of determining an appropriate time bucket size.
[2] Why not make it a weak symmetric signal then? Because the strong signal is great for genuinely distinct accounts. The penalties will tend to be distributed fairly equally between the two, correctly depressing the scores of both accounts.
Thank you for sharing. Very interesting. All your blog posts are fascinating. I really appreciate all you do and have done to maintain this community.