Introduction
I finally got around to open sourcing flow disruptor, a tool I wrote at work late last year. What does it do? Glad you asked! Flow disruptor is a deterministic per-flow network condition simulator.
To unpack that description a bit, per-flow means that the network conditions are simulated separately for each TCP connection rather than on the link layer. Deterministic means that we normalize as many network conditions as possible (e.g. RTT, bandwidth), and any changes in those conditions happen at preconfigured times rather than randomly. For example the configuration could specify that the connection experiences a packet loss exactly 5s after it was initiated, and then a packet loss every 1s after that. Or that packet loss happens at a specifed level of bandwidth limit based queueing.
You can check the Github repo linked above for the code and for
documentation on e.g. configuration. This blog post is more on why
this tool exists and why it looks the way it does.
Motivation and an example
Why write yet another network simulator? The use case here is fairly specific; we want to compare the behavior of different TCP implementations (our own and others') under controlled conditions. Doing this with random packet loss, or with different connections having different RTTs would be quite tricky. We also want each TCP connection to be as isolated from the other traffic as possible. With link level network simulation it's really easy to have test cases bleed into each other or some background traffic to mess things up, unless you're really careful.
Here's an example. This is looking at the behavior of half a dozen large CDNs, and a few operating system installations with no tuning at all by downloading an equally large file from them all. This particular scenario set up a 200ms base RTT (200ms no matter how far away from the test client the server is, the amount of extra delay added depends on the observed latencies from the proxy to the client and the server), and alternating between a 2Mbps and a 4Mbps bandwidth limit every 5 seconds.
profile {
    id: "200ms-variable-bandwidth"
    filter: "tcp and port 80 or 443"
    target_rtt: 0.20
    dump_pcap: true

    downlink {
        throughput_kbps: 2000
    }
    uplink {
        throughput_kbps: 1000
    }

    timed_event {
        trigger_time: 5.0
        duration: 5.0
        repeat_interval: 10.0

        downlink {
            throughput_kbps_change: 2000
        }
    }
}
Below is the pattern of RTTs produced for a download of a 10MB file. Time in seconds on X axis, time between segment sent and segment acked on Y axis. It might look like a line graph, but actually it's a scatterplot where every dot is a single segment. It's just that there are a lot of RTT samples. I've removed the legend from the graph, since the data is pretty old and the point here isn't an argument about what's reasonable TCP behavior and what isn't. But just so that you have a frame of reference, the hot pink dots (4th from the top) are Linux 3.16.
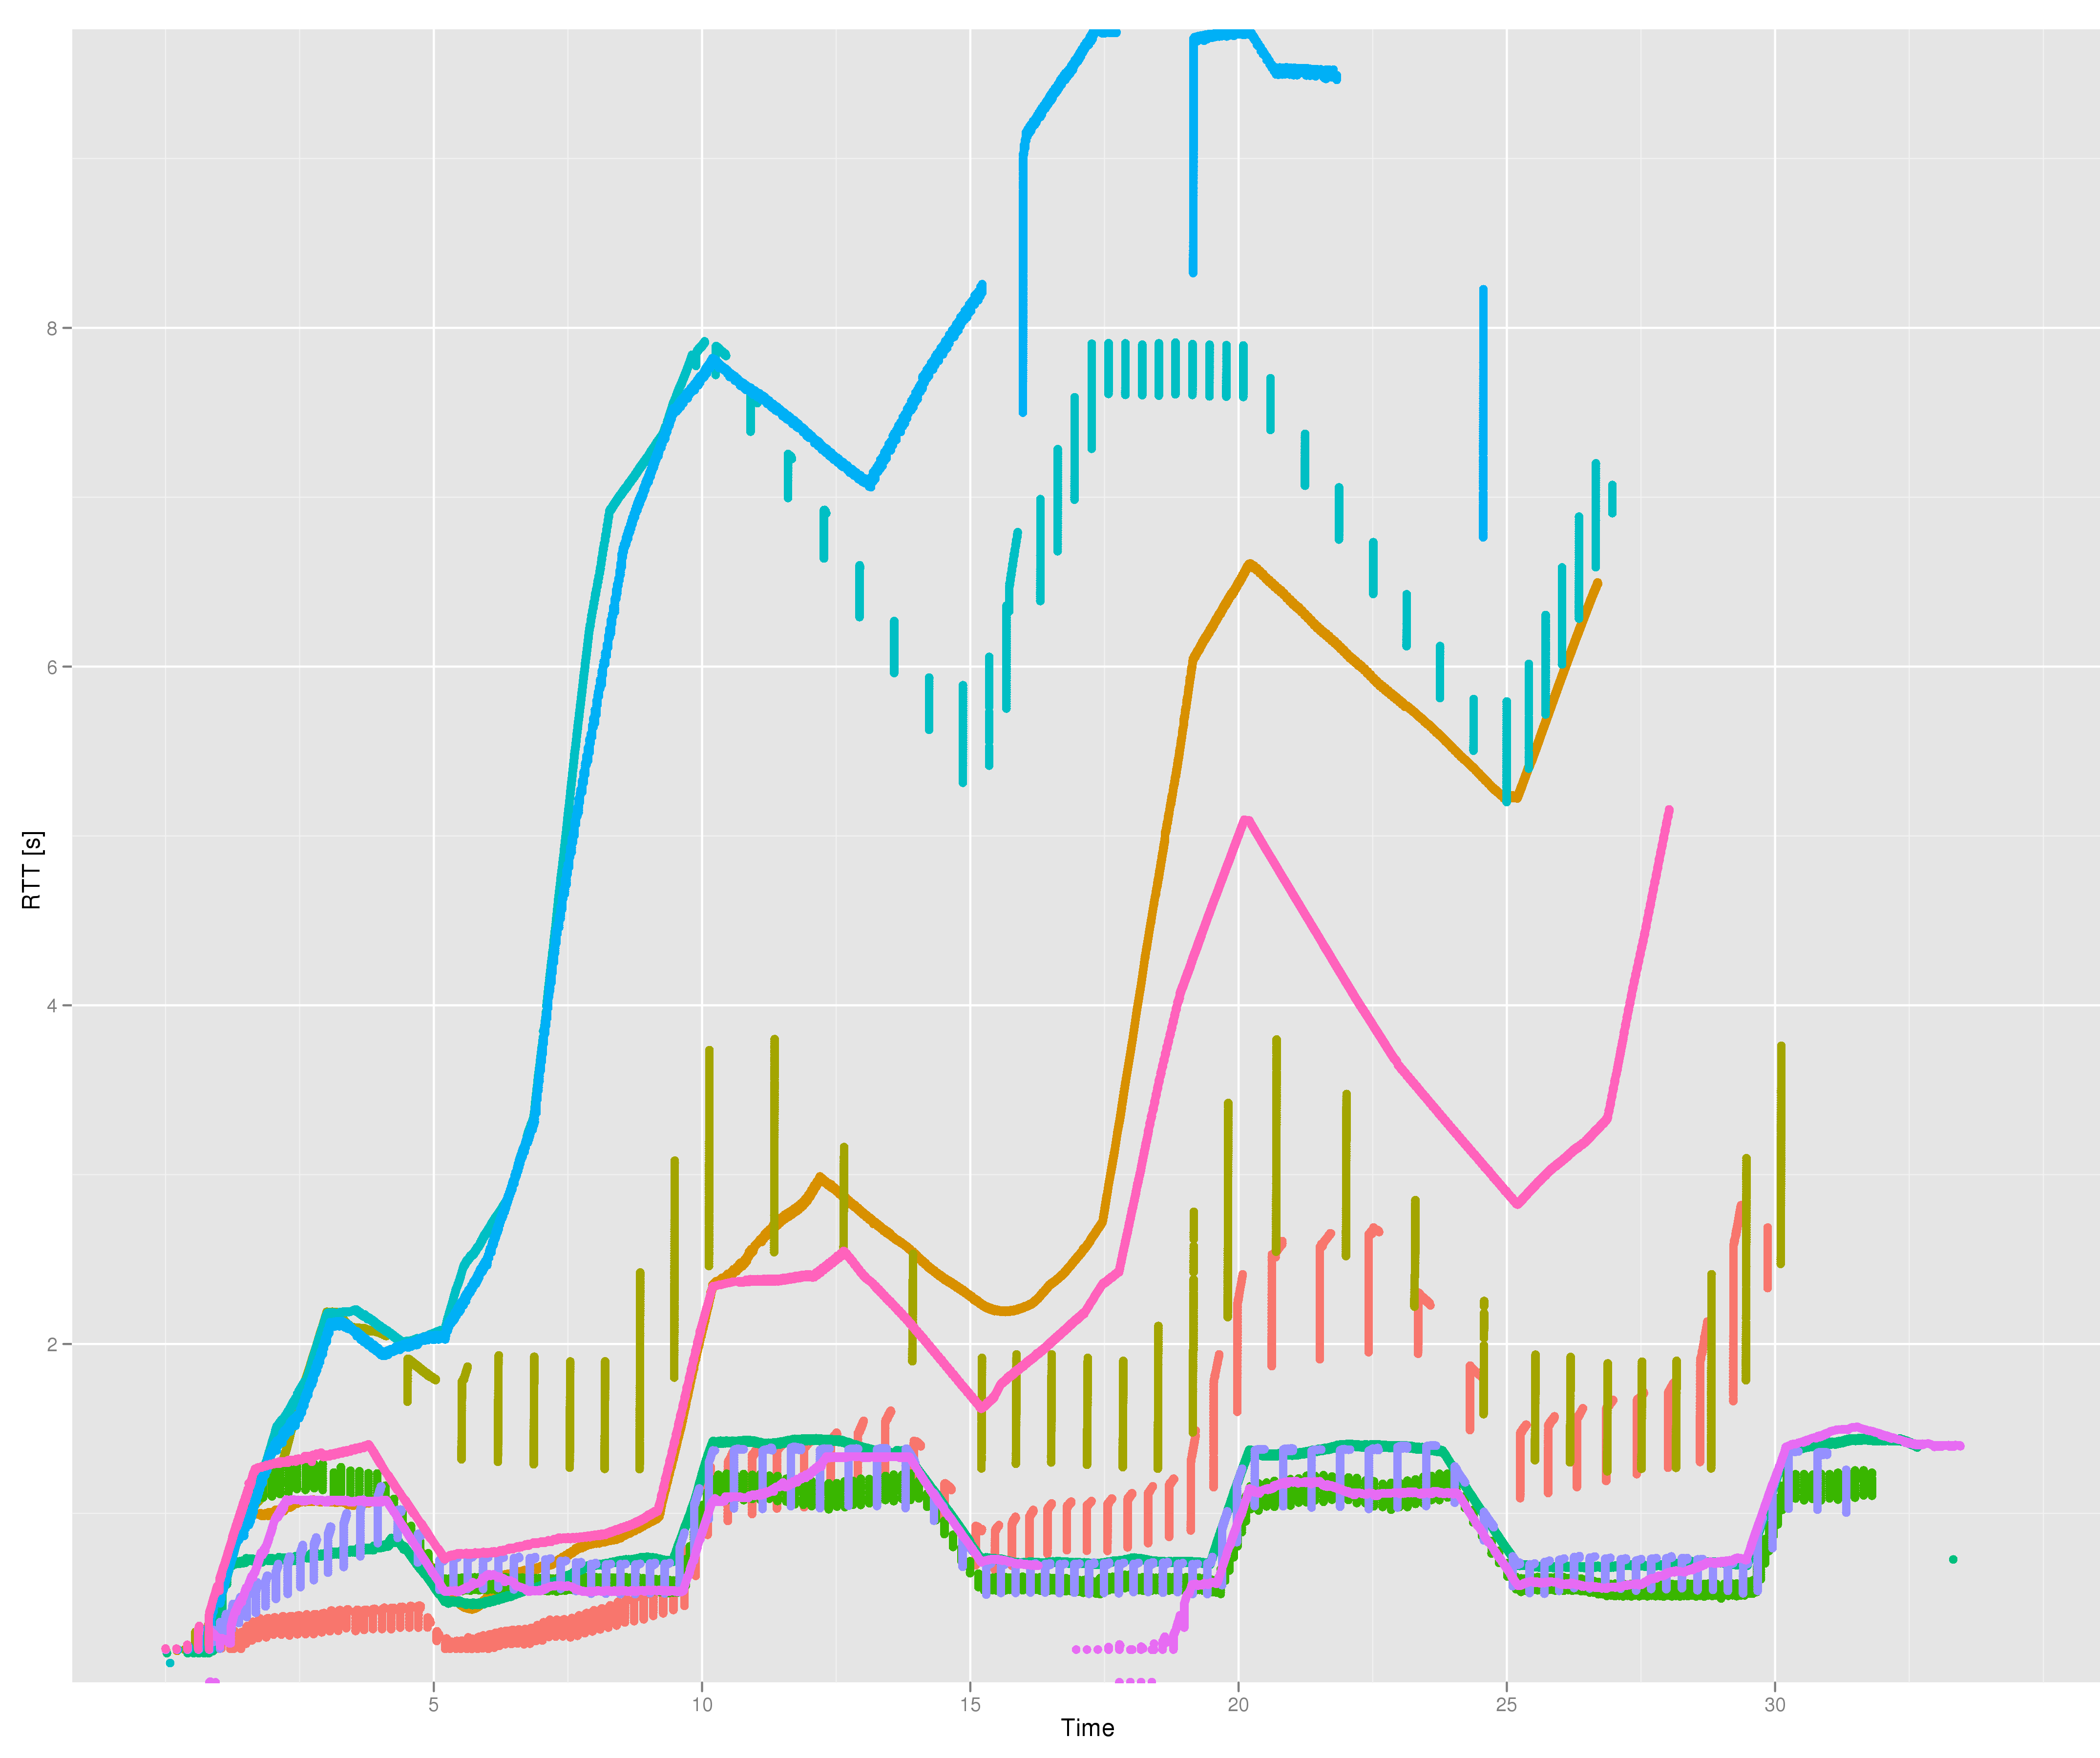
What does that graph tell us? Well, when the available bandwidth changes, it's the RTT that changes rather than the amount of data in flight. This suggests that none of the tested servers uses a RTT-based congestion control algorithm [0]. Which is of course not much of a surprise given the challenges in deploying one of those, but you never know. With no packet loss and no RTT feedback, it's not surprising that there's some major bufferbloat happening.
For another point of view, a similar graph but this time looking at the amount of data in flight (i.e. unacked) the moment each packet was sent:
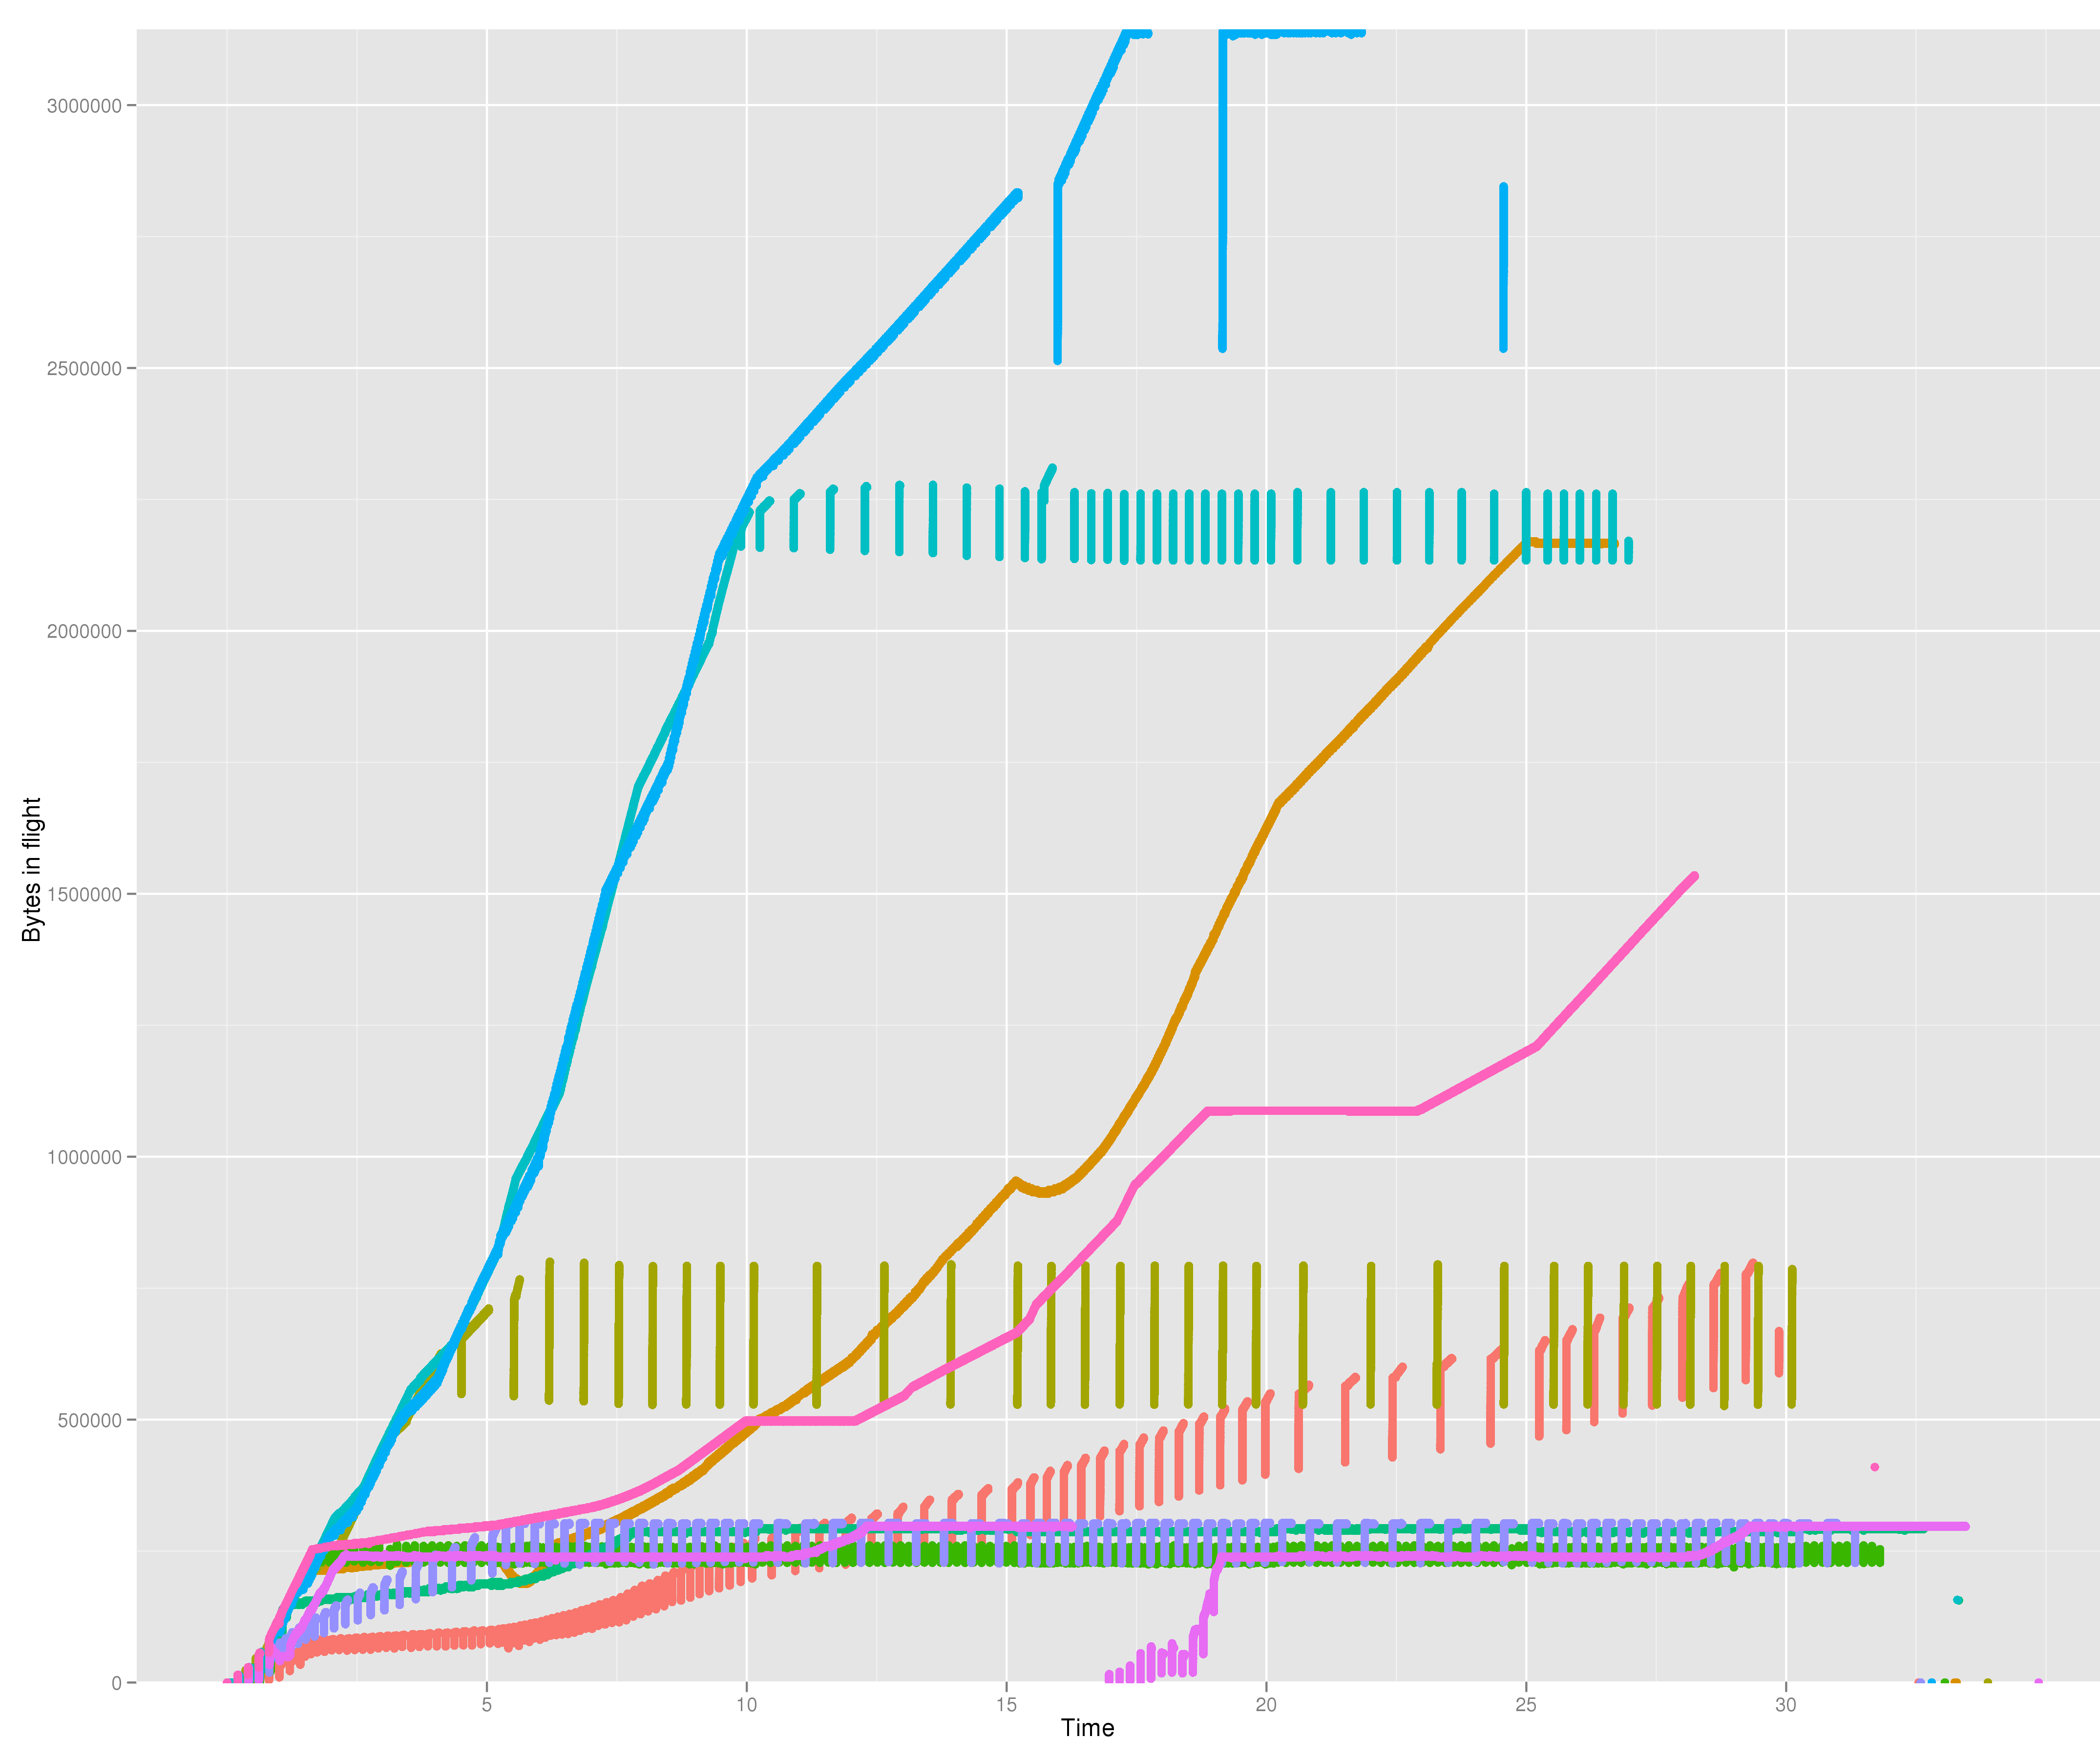
You can see that a lot of CDNs clamp the congestion window to reasonably sensible values (at around 256kB). Some others appear to have neither any limit to the congestion window nor any moral equivalent of a slow start threshold. Especially for a CDN that seems a bit questionable; CDNs are supposed to have endpoints near to the user, and there should be no need to keep such large amounts of data in flight to a nearby user.
And does overstuffing the buffers like this help? At a first glance it might appear to. After all the "lines" with high amounts of data in flight also end earlier. But that's just an artifact of them having 5-10s of data still undelivered when the last payload packet is sent. But if you look at the low right corner of the graph, you can see some orphan dots corresponding to the connection teardown. And thos are all happening at roughly the same time, as one would expect.
Another interesting thing is how some connections show up as one smooth line, while others instead appear to consist of vertical lines spaced out at fairly even intervals. This is probably the difference between the server reacting to an ACK by sending out data immediately, and the server reacting to an ACK only once sufficient congestion window space has been opened up and then filling it all at once. So for example see the olive green connection is extremely bursty, sending out chunks of 256kB at a go.
So that's the kind of transport layer investigation this tool was built for. You set up an interesting controlled scenario, run it against a bunch of different implementations, and see if anything crazy happens. What happens with an early packet loss, what happens with persistent packet losses, with different lengths of connection freezes, and so on. That's also why the simulator has a facility for generating trace files directly. It's rather useful for generating graphs like this, and have them pre-split by connection.
Implementation
This program was a bit of an experiment for me. On one hand it's pretty similar to a lot of programs we write at work, and could have shared a lot of code with the rest of the codebase. On the other hand (as I've written before) once a bit of code has been embedded in a monorepo, it can be really hard to extract it out.
So I set out to write this in a separate repository, preferring open source libraries instead of internal ones. In places where I wanted to use our existing code I just copied it over. If it felt ugly or out of place (as old but working code so often does), I rewrote it with no regard for keeping compatibility with all the existing clients of that code. You could say that the goal with this was to see whether life would be more pleasant if some of that old baggage was replaced.
Some of those experiments were:
- Protocol buffers for configuration instead of our existing JSON infrastructure.
- libev for the event loop, timers and signal handling instead of our in-house equivalents.
- CMake for building.
- More aggressive use of C++11 features than we can use in our real code, due to needing to support gcc 4.4.
Configuration
Most of my time at Google was spent working on an in-house programming language used for configuration [1]. It'd take in 10KLOC programs split across multiple files that described the configurations of systems, compile them to 100KLOC protocol buffers, and those protobufs would then be used as the actual configuration of record. So I'm pretty comfortable with using protocol buffers for configuration, but less so for using the text protocol buffer format for it. There's a reason configuration ended up requiring a separate language there. But this is a simple task where configs are unlikely to be anywhere near that size, so perhaps ascii protobufs would work just fine?
The protocol buffer text format actually turned out to be pretty pleasant to use for this, which makes some sense given how similar it is to JSON. One difference that didn't really matter is the lack of maps. I never want them in my configs, so that's ok. The second big difference was lists vs. repeated fields. Repeated fields of scalar values are indeed kind of awkward. Compare this:
"a": [1, 2, 3]Versus this:
a: 1
a: 2
a: 3
But I rarely have lists of that sort in a configuration. It's always a collection of some kind of complex compound structures. And there the repeated field syntax feels more natural since it removes so much of the noise.
"profiles": [{
  "id": "p80",
  "filter": "tcp and port 80",
  ...
}, {
  "id": "p443",
  "filter": "tcp and port 443",
  ...
}]
profile {
  id: "p80"
  filter: "tcp and port 80"
}
profile {
  id: "p443"
  filter: "tcp and port 443"
  ...
}
What didn't end up working well was accessing the protocol buffers using the generated code. It's of course great for accessing the contents of the configuration tree in its raw form. But it turns out I rather like for the reified configuration objects to have some smarts built into them, not be just a pile of data. Here's what the protobuf schema for the profiles looks like:
message FlowDisruptorProfile {
    required string id = 1;
    optional string filter = 2;
    ...
}
This is how the same definition fragment would look like for our existing JSON schemas:
DECLARE_FIELD(string, id, "")
DECLARE_FIELD(config_packet_filter_t, filter, config_packet_filter_t())
...
Yes, that's some ghetto syntax [2]. But the real difference is that
we've been able to declare a more useful data type for
the filter field than just string. When we parse a JSON
message with this field, the filter field is
automatically parsed as a pcap filter, compiled to BPF, and the actual
compiled BPF program is then accessible through the config object. If
compilation fails, parsing of the JSON object as a whole fails. If a
configuration is copied or two configurations are merged together,
deep copies of the compiled filters will be done as appropriate.
As far as I can tell this isn't really possible with the protocol buffer solution. As soon as any data gets some slightly more complex semantic meaning, you need a separate and manual validation layer. Or even worse, in this case since we don't just want to validate the data, but actually want to generate a complex domain object from it at parse time. This means there will actually be two parallel hierarchies of objects, one for the raw protobuf Messages and another for the domain objects. And these conversions aren't really amenable to any kind of automation through e.g. reflection.
It's not just a issue with filters either, that's just an example. In the real application we have custom field types for all kinds of networking concepts. IP addresses, MAC addresses, subnets, and so on. (And it's absolutely trivial to define new ones).
This isn't too big a deal in this program since it's just that one field right now. It'd be incredibly annoying in our real product that has tens of config variables that require this kind of handling. Manually maintaining the raw config vs. domain object mappings for all of them would be painful and a source of lots of errors.
So this part didn't turn out at all like I expected. The part that I was expecting to have some problems with was really nice at least given my config sizes. The part that I thought protobufs would work well with turned out to kind of suck. This is, of course, not a problem with protocol buffers but with me trying to use them for the wrong job. But it's strange that I never noticed this mismatch before.
Timers and other events
An event loop that integrates all kinds of events is certainly easy to program for. The event types in this program were timers, IO on fds, and signal handlers (run synchronously as part of the event loop, even if signal was asynchronous). The bits of libev I didn't need right now are things I could at least imagine needing at some point.
That's not how we write our traffic handling loops at work though. At the innermost level you'll have poll-mode packet handling, running on multiple interfaces and reading and handling at most a small number (e.g. 10) packets from each interface in one go. Go one layer outward, and we have a loop that interleaves the above packet handling with updating our idea of time and running timers if necessary [3]. That loop runs for a predetermined amount of time (e.g. 10ms) before yeilding to operational tasks for a short while. For example updating certain kinds of counters that are sample-based rather than event based (e.g. CPU utilization or NIC statistics), restarting child processes that have died, or handling RPCs. But of course at most one RPC reply before returning back to traffic handling.
As far as I know, this kind of setup isn't uncommon for single-threaded networking appliances. You need careful control of the event loop to make sure that work is batched together in sensibly sized chunks and that you're not away from the actual work for too long.
I couldn't figure out whether there would be a way to coerce libev to a structure like this. There are some options there for embedding event loops inside other event loops, but it feels like it'd be very ugly if it worked at all. So it's a really nice library, but probably not the right match for the application. (See also the digression about memory allocation later).
Closures and auto
The way I ended up using libev was with a couple of trivial wrapper classes, where the handler callback was passed in as a C++11 closure. (Yes, yes, every other language has had this since the '70s. Doesn't mean it's any less nice to finally have it in this environment too).
It's absolutely dreamy for defining timers, which need a callback function and some kind of state for the callback to operate on, usually passed in as an argument. So the difference is essentially between declaring a timer in a class like this:
Timer tick_timer_;
And initializing it like this:
tick_timer_(state, [this] (Timer*) { tick(); }),
Versus the relative tedium of defining a new class with the callback + the data as a poor man's closure, or by defining a separate trampoline function for every kind of timer.
And after having gone this route for event handlers, it was then very easy to slip into doing it all over the place. Instead of maintaining a vector of some sort of records that are later acted on, just maintain a vector of closures instead that do the right thing when called. For example the token bucket-style bandwidth throttler implementation doesn't know anything about packets. It just gets costs and opaque functions as input, and calls the function once the cost can be covered.
There's a small problem with the event handler definitions, since you need to allocate some memory for the closure in a separate block (the value cells for the closed over variables need to live somewhere). It's not obvious to me that any amount of template magic would allow working around that. And we tend to be a bit paranoid about lots of tiny separate allocations. So it's something I want, but maybe not something I can actually justify using.
The new for-loop and auto are just pure win,
again not very surprising. I used both a lot, and even returning to
the code now a year later didn't really see any places where the
shorthands make the code harder to understand.
Build system
I've found that build systems sucking and being hated by all the users is a good baseline assumption to make. I didn't hate CMake though. In fact it seems perfect for a C++ program of this size. It came with enough batteries included to do everything I wanted to, and the (horribly named) CMakeLists.txt file for this project has very little boilerplate. It even appears to do transitive propagation of compiler / linker flags through dependencies in a sane manner, which is a problem that usually drives me completely nuts.
I wasn't able to build a mental model of how CMake works though. At least there was never any hope of being able to correctly guess how to do something new, or change the behavior of something. It was always off to a web search for vaguely plausible keywords. So my first impression was that it's a collection of very specialized bits of functionality, and once you have to do anything that's not already support, the complexity shoots up. But clearly it's worth giving CMake a good look the next time I want to burn our rat's nest of recursive makefiles to the ground and rebuild things.
Other experiments
I tried a couple of other funky things like using protocol buffers
to represent the parsed packet headers rather than doing the usual
trick of just casting the data to a packed C struct.
Not sure it really bought anything in the end, I can't figure out
what the motivation was back when I wrote the code. Maybe to use
them as the disk serialization format for traces? But that's
obviously stupid, since all of our analysis tools already work on
pcap format. Or maybe I wanted to print some debug output, but
didn't want to import our packet pretty-printer and all of its
dependencies into this project? (The curse of the monorepo, again).
Conclusion
As I mentioned before, this tool was built for a specific purpose. But when I described it to someone last week, they came up with a completely different use that might be very interesting (though it'll require a bit of extra work to automatically create some much more intricate scenario definitions, so we'll see how practical it turns out in practice). So maybe this has slightly wider applicability than I initially thought. If you come up with a cool new use for the tool, I'd love to know about it.
Footnotes
[0] Ok, it's plausible that the RTT sensitivity only kicks in after a fairly high threshold. Say 2 seconds. So to be absolutely sure you'd need another test case with an even lower bandwidth limit, to force all of the connections into the 3-4 second territory.
[1] borgcfg / GCL
[2]
It gets translated to C++ using a couple of cpp
invocations, which rather sharply limits the syntax. Who has time for
a real schema compiler when there's a product to be shipped?
[3] I was once explaining the guts of our system to some people to figure out how we might integrate their system and ours. And I could just sense the disapproval when I admitted that we didn't have a bound on the number of timers that could get triggered in a single timer tick. How irresponsible, we have no idea of how long we might go between calls to the packet processing layer of the IO loop!